


NGCP has the crucial role of linking power generators and distribution utilities to deliver electricity where it is most needed. Its network of interconnected transmission towers and substations serves as the highway where electricity travels from various energy sources to the smaller thoroughfares of distribution utilities and electric cooperatives until it reaches the households.
(picture of Philippine Power Industry)
NGCP's task is to ensure that the country's transmission assets are in optimal condition to convey safe, quality, and reliable electricity. NGCP does this through regular inspection and repair of lines and substations, clearing of Right-of-Way obstructions, and timely restoration during and after natural disasters.
(picture of Typhoon Restoration)
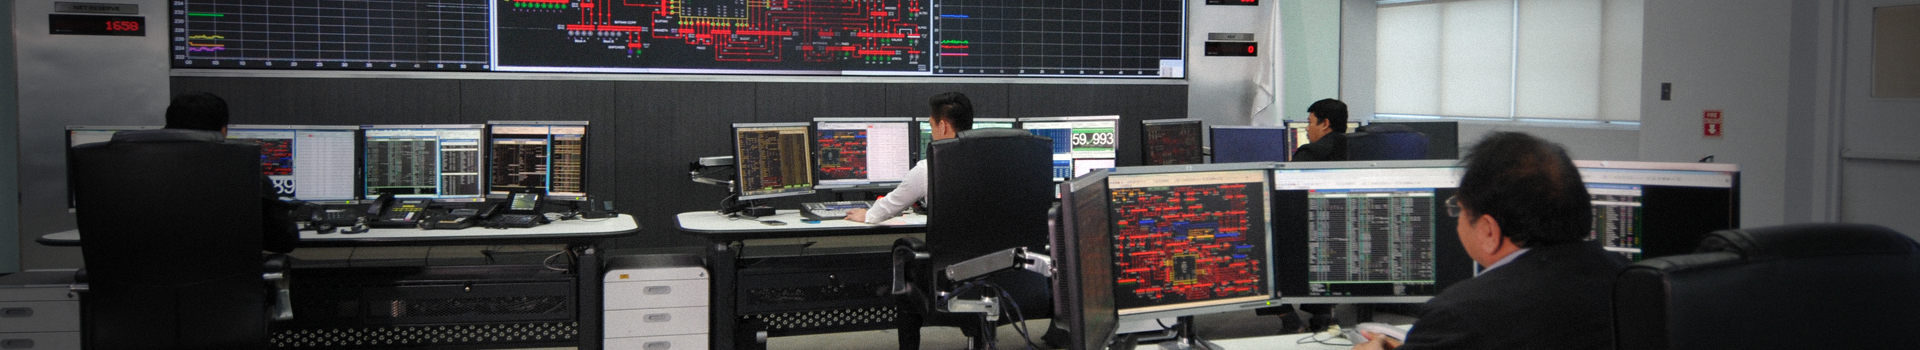
Reliability of power is the company's utmost priority so it closely monitors the grid and immediately responds to any system disturbance. NGCP acts as System Operator that balances the supply and demand of power to maintain the quality of electricity that flows through the grid.
(picture of LRCC)
Building new transmission lines and expanding substation capacity are equally important as increasing power supply. NGCP ensures that the grid is prepared whenever new plants come online and when the demand for power in a certain area increases by anticipating these scenarios and constructing new facilities. All of NGCP's projects are well laid out in its 10-year Transmission Development Plan.
(picture of project construction and link to the TDP)
NGCP is the only transmission business in the country, with more than 21,000 circuit kilometers of lines, 20,000 transmission towers, and 140 substations. The company ensures that its services are available when and where it is needed.
NGCP operates all transmission facilities in the following areas:
Luzon
Composed of Metro Manila, North Luzon, and South Luzon, the largest grid in the country accounts for 74% of the country's total power demand.
| North Luzon | ||
|---|---|---|
| DISTRICT | AREA | SERVICE AREA |
| 1 | Ilocos | Ilocos Norte, Ilocos Sur, Abra, and La Union |
| 2 | Mountain Province |
Mt. Province and Benguet |
| 3 | Central Plain | East And West Pangasinan |
| 4 | Cagayan Valley | Nueva Vizcaya, Quirino, Ifugao, Isabela, Cagayan, Kalinga, and Apayao |
| 5 |
Western Central Plain | Bataan and Zambales |
| 6 | South Central Plain | Pampanga and Tarlac |
| 7 | NCR | Bulacan, Rizal, and Metro Manila |
| South Luzon | ||
| DISTRICT | AREA | SERVICE AREA |
| 1 | South Western Tagalog | Batangas, Cavite, and South Of Metro Manila |
| 2 | South Eastern Tagalog | Laguna and Quezon |
| 3 |
Bicol | Camarines Norte, Camarines Sur, Albay, and Sorsogon |
Visayas
The interconnected island grids of Cebu, Negros, Panay, Leyte, Samar, and Bohol compose the Visayas grid. The region accounts for 14% of the country's power demand.
| Visayas | ||
| DISTRICT | AREA | SERVICE AREA |
1 |
Western | Samar and Leyte |
| 2 | Central | Cebu and Bohol |
| 3 | Eastern | Negros Island |
| 4 |
Negros | Panay Island |
Mindanao
Mindanao is strategically located in the southernmost section of the archipelago, making it a center of trade and major transhipment point between the East ASEAN regions, particularly to Eastern Indonesia, Malaysia, and Brunei Darussalam. It accounts for 12% of the total power demand.
| North Luzon | ||
| DISTRICT | AREA | SERVICE AREA |
| 1 | North Western | Zamboanga Del Norte, Zamboanga Del Sur, and Misamis Occidental |
| 2 | Lanao | Lanao Del Norte and Lanao Del Sur |
| 3 | North Central | Bukidnon and Misamis Oriental |
| 4 | North Eastern | Agusan Del Norte, Agusan Del Sur, Surigao Del Norte, and Surigao Del Sur |
| 5 | South Eastern | Davao, Davao Del Norte, Davao Del Sur, Compostella Valley, and Davao Oriental |
| 6 | South Western | North Cotabato, South Cotabato, Sultan Kudarat, Maguindanao, and Sarangani |
Power Situation Outlook
|
|||
|---|---|---|---|
| LUZON | VISAYAS | MINDANAO | |
| Available Generating Capacity (MW) | |||
| System Peak Demand (MW) | |||
| Operating Margin (MW) | |||
Power Situation Outlook
|
|||||||||
|---|---|---|---|---|---|---|---|---|---|
| LUZON | VISAYAS | MINDANAO | |||||||
| Morning | Afternoon | Evening | Morning | Afternoon | Evening | Morning | Afternoon | Evening | |
| Available Generating Capacity (MW) | |||||||||
| System Peak Demand (MW) | |||||||||
| Operating Margin (MW) | |||||||||
WEEKLY OUTLOOK FOR LUZONPeriod Covered ( )
Note: Daily Update is Monday to Friday only |
|---|
WEEKLY OUTLOOK FOR VISAYASPeriod Covered ( )
Note: Daily Update is Monday to Friday only |
|---|
WEEKLY OUTLOOK FOR BOHOLPeriod Covered ( )
Note: Daily Update is Monday to Friday only |
|---|
WEEKLY OUTLOOK FOR LEYTE-SAMARPeriod Covered ( )
Note: Daily Update is Monday to Friday only |
|---|
WEEKLY OUTLOOK FOR PANAYPeriod Covered ( )
Note: Daily Update is Monday to Friday only |
|---|
WEEKLY OUTLOOK FOR NEGROSPeriod Covered ( )
Note: Daily Update is Monday to Friday only |
|---|
WEEKLY OUTLOOK FOR CEBUPeriod Covered ( )
Note: Daily Update is Monday to Friday only |
|---|
WEEKLY OUTLOOK FOR MINDANAOPeriod Covered ( )
Note: Daily Update is Monday to Friday only |
|---|
Note: All data in MW units
NGCP implements various transmission and substation projects in accordance with its 10-year Transmission Development Plan. Each project contributes to the over-all reliability and security of the grid.
| Article | Date Posted |
|---|
The highest aggregate demand for a specific period of generators in Megawatt.
(videos and pictures of Transmission Safety)
The total electricity consumption per political region of the Philippines, in kiloWatt-hour (kWh) measured and indicated by the meter for the billing period adjusted for applicable corrections and rounded off to the nearest full kWh.
(videos and pictures of Anti-Pilferage)
Data table providing the total number of circuit kilometers of transmission and Sub-transmission assets per Grid for a specific period. Furthermore, data table shows the total substation capacity in MVA per Grid for a specific period.
(photo gallery of Environmental events)
The Active Power or Reactive Power required by a load expressed MW in an hourly interval. Classified per Grid.
(photo gallery of Education-CSR programs)
The maximum energy produced monthly by a unit classified according to the fuel used operated continously at maximum capacity.
(photo gallery of CSR Donations)
Monthly percent (%) TSL per Grid. The % TSL is computed by getting the difference of Net Generation and Energy from Grid Exit Points and dividing it by Net Generation.